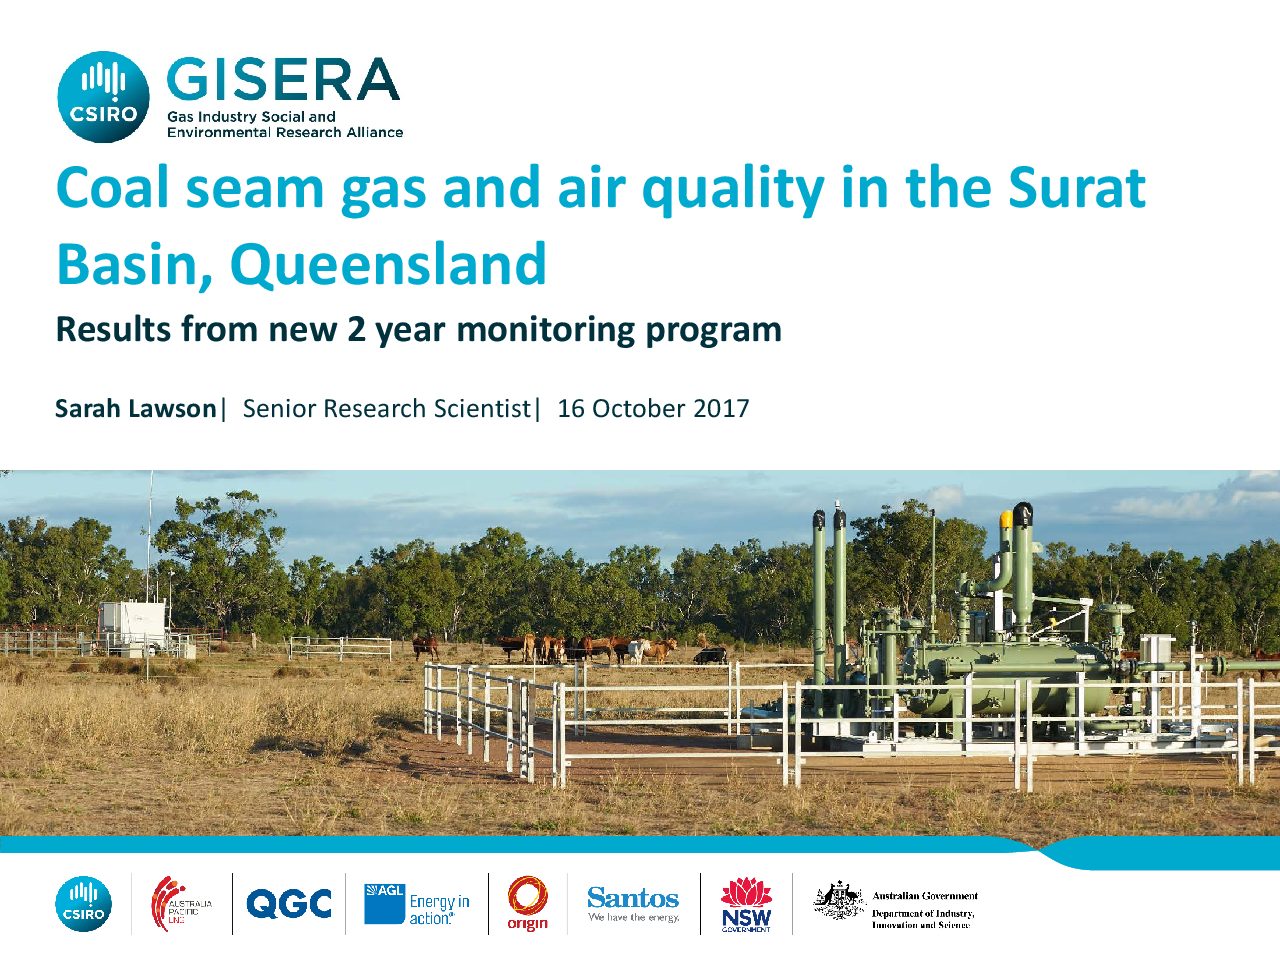
Ambient air quality in the Surat Basin
This project involves a comprehensive assessment of air quality in the Surat Basin region in Queensland using air quality measurement network and modelling to identify the impact of CSG production activities on air quality in the Surat region.
Watch this video to find out the results from the three year study.
[The CSIRO, Australia Pacific LNG, QGC, Origin, Santos, NSW Government and Australian Government Department of Industry, Innovation and Science logos and text appears: GISERA, Gas Industry Social and Environmental Research Alliance, www.gisera.csiro.au]
[Music plays and text appears on a green screen: Research Update, Assessing the air quality in the Surat Basin, September 2018]
[Image changes to show Sarah Lawson walking towards the air quality station and then the image changes to show an aerial view of the CSG site and the camera pans over the site]
Sarah Lawson: This project is the most comprehensive assessment of air quality in a coal seam gas region in Australia to date.
[Image changes to show Sarah Lawson talking to the camera and text appears: Sarah Lawson, Senior Research Scientist, CSIRO]
The purpose of the study was to compare pollution levels with air quality objectives and to make an overall assessment of air quality in the region.
[Images move through of Sarah looking at data on a screen inside the station, a profile view of Sarah’s face, her hands on the keyboard and Sarah looking at the data on a screen again]
We made continuous measurements of pollutants via five ambient air monitoring sites as well as measurements via ten passive gas sites.
[Image changes to show Sarah standing in a paddock and talking to the camera]
Volatile organic compound levels were generally very low and typical of other rural areas in Australia.
[Image changes to show vehicles and pedestrians moving around in the main streets of Chinchilla and then the image changes to show Sarah talking to the camera with a paddock in the background]
We found the highest levels of benzene, toluene and xylene actually in the Chinchilla township and this was attributed to emissions from vehicle exhaust and from other sources within the town.
[Image changes to show grass waving in the wind and the image sharpens gradually to show the CSG site in the background]
Particle levels were generally well below air quality objectives.
[Images move through of Sarah inside the air quality monitoring station working a touch screen, the touch screen she is working on, and data on various screens]
However, there were a few occasions when the particle levels did exceed the 24-hour average air quality objectives.
[Images move through of Sarah talking, a bushfire scene, a car driving along a dusty road, an aerial view of a car on a dirt track, dust blowing behind a tractor, and an aerial view of the CSG site]
Where this occurred, we found that the sources of the particles were typical of rural areas and generally came from bushfire smoke, wind blown dust, vehicles travelling on unsealed roads, particles from agriculture and CSG development and operational activity.
[Image changes to show Sarah working on the touch screen inside the air quality monitoring station and then the image changes to show Sarah talking to the camera]
The CSIRO Air Quality Modelling Study will be the final output for this project.
[Image changes to show data from the study scrolling through on the screen and then the image changes to show Sarah talking to the camera with a dry paddock in the background]
So, the data from this study can be used by current and future studies such as the Gisera Health Study and the Impacts of Hydraulic Fracturing Study.
[Image changes to show Sarah’s hand operating the touch screen and then the image changes to show a profile view of Sarah looking up at the screen]
The data can also be used by government to inform future policy decisions.
[Image changes to show Sarah talking to the camera with a dry paddock in the background]
For community, this project provides really important information about the sources and types of pollutants in a coal-seam gas region in Australia for the first time.
[Music plays and the CSIRO, Australia Pacific LNG, QGC, Origin, Santos, NSW Government and Australian Government Department of Industry, Innovation and Science logos and text appears: GISERA, Gas Industry Social and Environmental Research Alliance, www.gisera.csiro.au]
Research finds good air quality in the study region, September 2018.
Watch this video for information about live streaming the data (2016).
[Music plays and CSIRO and GISERA logos and text appears: Gas Industry Social & Environmental Research Alliance]
[Text appears: Assessing the air quality in the Surat Basin]
[Image appears of Sarah Lawson getting out of a car and walking towards the Ambient Air Quality Station and then the camera zooms out and shows an aerial view of Sarah Lawson walking around the Ambient Air Quality Station]
Sarah Lawson: All human activity has an impact on the atmosphere and it can be difficult to figure out which source is actually contributing to the air pollution. This project is looking at ambient air quality in the Surat Basin.
[Camera zooms in on Sarah Lawson entering the Ambient Air Quality Station]
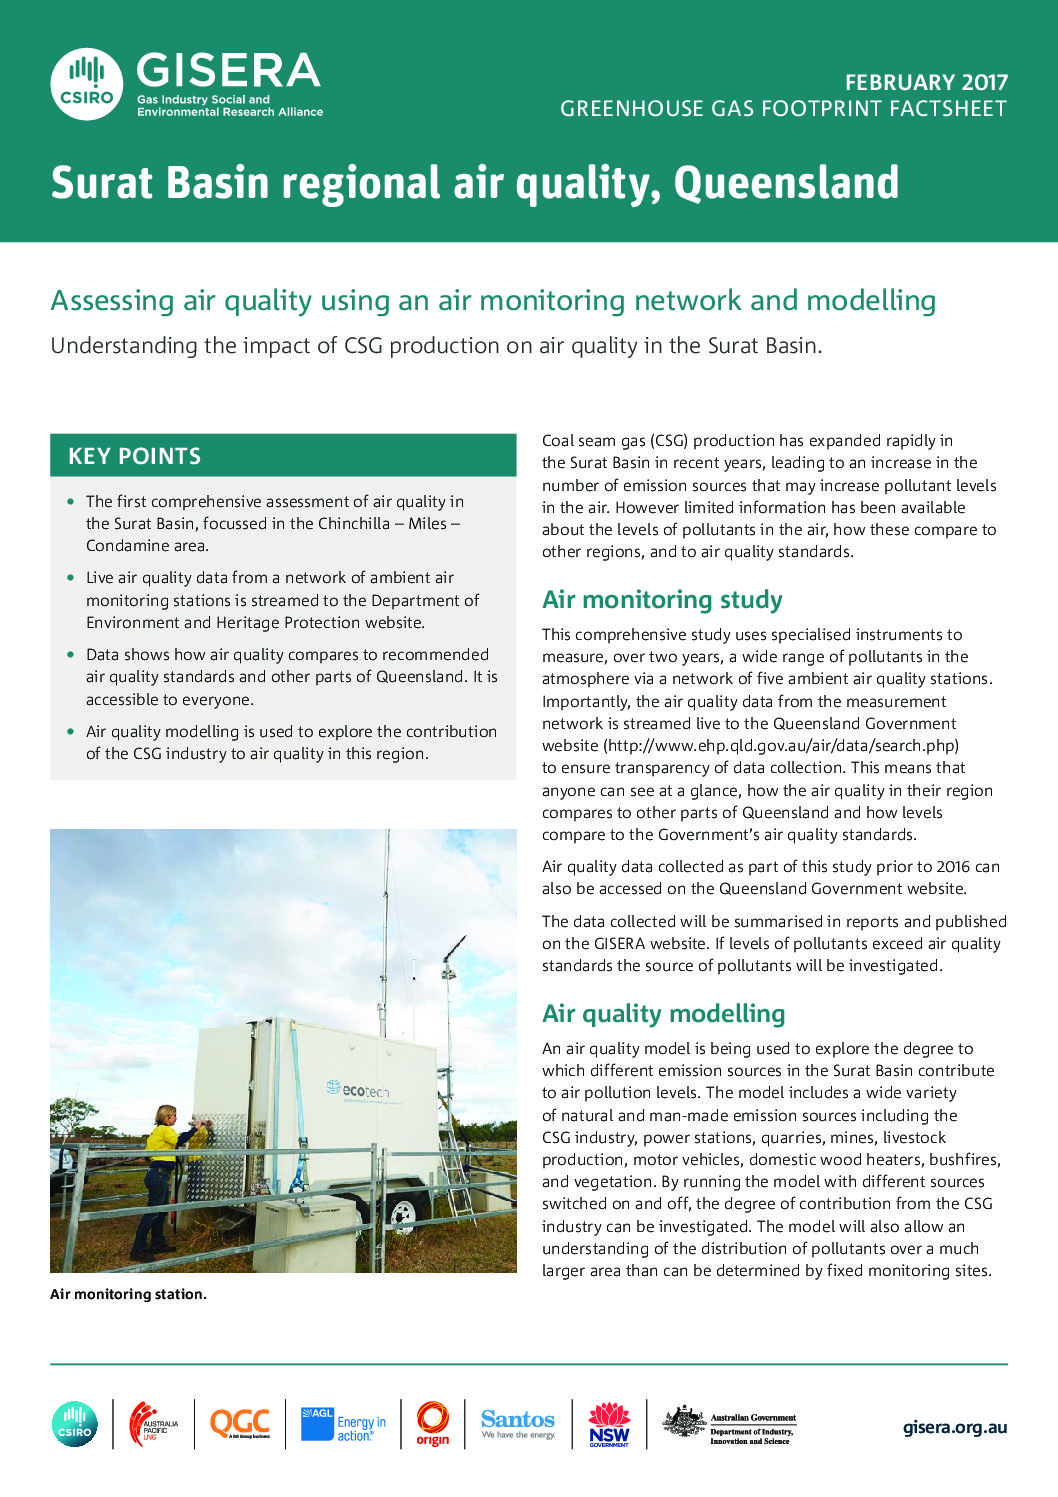
An Ambient Air Quality Station is really a building, which contains a whole lot of really specialised ambient air monitoring equipment.
[Image changes to show the inlet and then the image changes to show a diagram of air moving through the inlet and then the image changes to show Sarah Lawson taking notes and operating a touch computer screen]
So we have an inlet and the air is drawn down the inlet via a pump and then each of the specialised instruments takes a little bit of that air, analyses it for the selected pollutant
[Camera zooms in on Sarah Lawson’s face and then the camera zooms out to show Sarah Lawson operating a computer and then the camera zooms in on the Hourly Air Quality data information page on the computer screen]
and then provides the reading or the pollutant concentrations to the computer where it’s then streamed to the E.P.A. website.
[Image changes to show Sarah Lawson talking to the camera and text appears: Sarah Lawson, Senior Research Scientist, CSIRO Oceans and Atmosphere]
So we’re going to use an Air Quality Model in this project to try to separate out the contribution of different sources to the air pollution that we observe.
[Image changes to show air swirling around a map of Australia with text Sea salt, Smoke, Dust and Biogenic pinpointed]
So what we can do in the model is include all sources of pollution, so the C.S.G. industry, the bushfires and the cars and we do a model run
[Image shows air swirling around the map of Australia minus the pinpointed text]
and then we can actually turn off the C.S.G. industry emissions in the second model run and then look for the difference between the two runs
[Image changes to show Sarah Lawson talking to the camera and then the image changes to show the Ambient Air Quality Station]
and in this way we can try to tease out what is the contribution of the C.S.G. industry to the pollution that we observe
[Image shows Sarah Lawson working inside the Ambient Air Quality Station and then the camera zooms in on Sarah Lawson talking to the camera]
and then we can compare the levels of air pollutants that we find to other areas in Queensland to give us an idea about how this region compares and we can also compare the levels of pollutants that we find to the Government’s Air Quality Goals.
[Image changes to show Sarah Lawson working inside the Ambient Air Quality Station and then the image changes to show an outside view of the Station]
The Government will use the data to inform future policy development and industry will use the data to improve their practices.
[Image changes to show Sarah Lawson talking to the camera]
I think the really exciting thing about this project is that we’ll actually be making the data from the Air Quality Network available to the community, to Government and to industry in near real-time.
[Images flash through of different screens displaying Hourly Air Quality data and then the image changes to show Sarah Lawson talking to the camera]
So what that means for the community is that they can see in a glance what the air quality is like outside their window at a given time and how it compares to the rest of Queensland
[Image changes to show Sarah Lawson working inside the Ambient Air Quality Station and then the image changes to show Sarah Lawson talking to the camera]
and I think this is a really important part of the project. It provides complete transparency to the community.
[Music plays and CSIRO and GISERA logos and text appears: Gas Industry Social & Environmental Research Alliance]
[Sponsors logos and text appears: www.gisera.org.au]
Assessing air quality in the Surat Basin, August 2016
Reports and papers
Modelling air quality in the Surat Basin, Queensland
This project has provided the first comprehensive assessment of air quality in the Surat Basin using an air quality observation network and detailed air quality chemical transport modelling. This report delivers Task 3 of the project by presenting the air quality modelling component of the study and assessing the overall potential impact of CSG production activities on air pollutants levels in the Surat Basin.
Overall assessment of air quality in Surat Basin region from 2014-2018
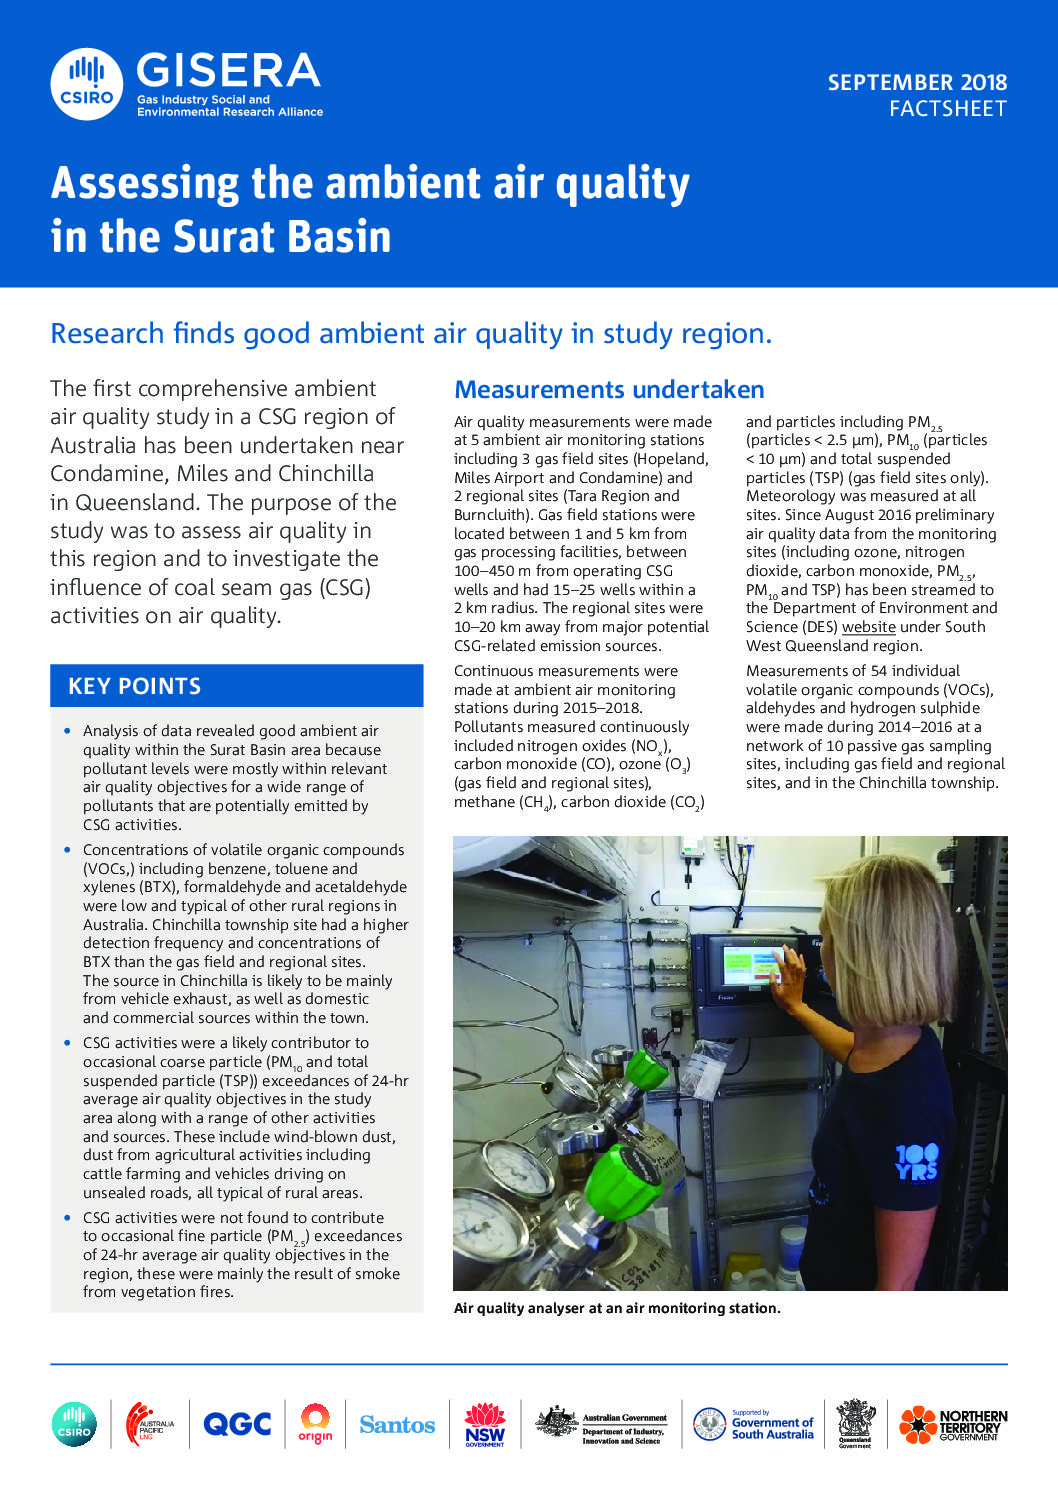
This is the first comprehensive ambient air quality study in a CSG region of Australia. The purpose of the study was to assess air quality in this region and to investigate the influence of coal seam gas (CSG) activities on air quality.
- Analysis of data revealed good air quality within the Surat Basin area because pollutant levels were mostly within relevant air quality objectives for a wide range of pollutants that are potentially emitted by CSG activities.
- Concentrations of volatile organic compounds (VOCs,) including benzene, toluene and xylenes (BTX), formaldehyde and acetaldehyde were low and typical of other rural regions in Australia. Chinchilla township site had a higher detection frequency and concentrations of BTX than the gas field and regional sites. The source in Chinchilla is likely to be from vehicle exhaust, as well as domestic and commercial sources within the town.
- CSG activities were a likely contributor to occasional coarse particle (PM10 and total suspended particle (TSP)) exceedances of 24-hr average air quality objectives in the study area along with a range of other activities and sources which are typical of rural areas such as wind-blown dust, dust from agricultural activities including cattle farming and vehicles driving on unsealed roads.
- CSG activities were not found to contribute to occasional fine particle (PM2.5) exceedances of 24-hr average air quality objectives in the region, these were mainly the result of smoke from vegetation fires.
Final data summary: January 2017-February 2018
This is the final data summary report for the project.
An assessment of ambient air quality in the Surat Basin, Queensland
An interim report on the analysis of data collected during September 2014 – December 2016. Read the fact sheet in the Extras section for key findings.
Ambient air quality in the Surat Basin - Study design
The purpose of this report is to provide background information about the study design and information about the project outputs for the next phases of this project.
The Appendix of the report contains environmental consultant reports showing measured gas composition, gas combustion composition and water composition (accessible below). These consultant reports were used by CSIRO to review the emission characteristics of CSG-related sources and were provided to CSIRO by Origin Energy. Sampling and analysis of gas and water were undertaken by consultants and were taken from Origin Energy CSG infrastructure. The consultants were engaged by Origin Energy.
Please note that reported surrogates (surr.) are compounds added in the laboratory process for quality control and were not present in the original samples.
Appendix A.1 – Measurements of CSG-related sources and emissionsA.1.1 Radiological surveys
A.1.2 Talinga GPF gas composition and WTF water composition
A.1.3 Emissions Monitoring: Talinga gas combustion emissions
A.1.3.2 Sep 2015 VOC and aldehyde emissions
A.1.4 Orana and Talinga wellhead gas and water composition
Extras
Volatile Organic Compound Passive Sampler Data
Lawson, Sarah; Powell, Jennifer; Dunne, Erin (2018): Volatile Organic Compound passive sampler data from GISERA Air Quality study. v1. CSIRO.
Assessing the ambient air quality in the Surat Basin
Research finds good air quality in the study region.
Ambient air quality in the Surat Basin
The outcomes of the project were presented at a knowledge transfer session held in September 2018.
Air quality assessment in the Surat Basin
Summary of key findings from the analysis of data collected during September 2014 – December 2016.
Key findings
- Levels of air pollutants measured were generally well below relevant air quality criteria.
- There were no exceedances of carbon monoxide (CO), nitrogen dioxide (NO2) or ozone (O3) air quality criteria at any of the regional or gas field sites.
- At gas field sites there were some exceedances of air quality criteria for particles less than 2.5 micrometres (PM2.5), particles less than 10 micrometres (PM10) and total suspended particles (TSP). There were no particle measurements made at regional sites.
- When particle exceedances occurred, the likely cause was investigated and found to be from fires, dust from cattle farming, CSG development and operational activities, other dust sources possibly including unsealed roads and other agricultural activities, as well as some unknown sources.
Methane was measured at the gas field sites as a tracer for CSG-related activities. Methane does not have an air quality criterion as it is not considered to pose a direct risk to human health in the ambient environment. - CSG emissions from infrastructure and activities were most likely the source of the largest observed methane concentrations at gas field sites. These CSG-related methane peaks were not associated with any exceedance of air quality criteria.
Coal seam gas and air quality in the Surat Basin, Queensland
Presentation given at The Clean Air Society of Australia and New Zealand conference.
Live streaming of data
Hourly air quality data is available through the Queensland Government Department of Environment and Heritage Protection.
Live stream air quality data from coal seam gas regions
Data from the first comprehensive air quality measurement program in the Surat Basin is now available online for anyone to live-stream.
Assessing air quality using an air monitoring network and modelling
Understanding the impact of CSG production on air quality in the Surat Basin.
Project Progress
This project is complete.
Project proposal
A detailed description of the project, budget and research milestones.