Live stream air quality data from coal seam gas regions
[Music plays and CSIRO and GISERA logos and text appears: Gas Industry Social & Environmental Research Alliance]
[Text appears: Assessing the air quality in the Surat Basin] [Image appears of Sarah Lawson getting out of a car and walking towards the Ambient Air Quality Station and then the camera zooms out and shows an aerial view of Sarah Lawson walking around the Ambient Air Quality Station]
Sarah Lawson: All human activity has an impact on the atmosphere and it can be difficult to figure out which source is actually contributing to the air pollution. This project is looking at ambient air quality in the Surat Basin.
[Camera zooms in on Sarah Lawson entering the Ambient Air Quality Station]
An Ambient Air Quality Station is really a building, which contains a whole lot of really specialised ambient air monitoring equipment. [Image changes to show the inlet and then the image changes to show a diagram of air moving through the inlet and then the image changes to show Sarah Lawson taking notes and operating a touch computer screen]
So we have an inlet and the air is drawn down the inlet via a pump and then each of the specialised instruments takes a little bit of that air, analyses it for the selected pollutant
[Camera zooms in on Sarah Lawson’s face and then the camera zooms out to show Sarah Lawson operating a computer and then the camera zooms in on the Hourly Air Quality data information page on the computer screen]
and then provides the reading or the pollutant concentrations to the computer where it’s then streamed to the E.P.A. website.
[Image changes to show Sarah Lawson talking to the camera and text appears: Sarah Lawson, Senior Research Scientist, CSIRO Oceans and Atmosphere]
So we’re going to use an Air Quality Model in this project to try to separate out the contribution of different sources to the air pollution that we observe.
[Image changes to show air swirling around a map of Australia with text Sea salt, Smoke, Dust and Biogenic pinpointed]
So what we can do in the model is include all sources of pollution, so the C.S.G. industry, the bushfires and the cars and we do a model run
[Image shows air swirling around the map of Australia minus the pinpointed text]
and then we can actually turn off the C.S.G. industry emissions in the second model run and then look for the difference between the two runs
[Image changes to show Sarah Lawson talking to the camera and then the image changes to show the Ambient Air Quality Station]
and in this way we can try to tease out what is the contribution of the C.S.G. industry to the pollution that we observe
[Image shows Sarah Lawson working inside the Ambient Air Quality Station and then the camera zooms in on Sarah Lawson talking to the camera]
and then we can compare the levels of air pollutants that we find to other areas in Queensland to give us an idea about how this region compares and we can also compare the levels of pollutants that we find to the Government’s Air Quality Goals.
[Image changes to show Sarah Lawson working inside the Ambient Air Quality Station and then the image changes to show an outside view of the Station]
The Government will use the data to inform future policy development and industry will use the data to improve their practices.
[Image changes to show Sarah Lawson talking to the camera]
I think the really exciting thing about this project is that we’ll actually be making the data from the Air Quality Network available to the community, to Government and to industry in near real-time.
[Images flash through of different screens displaying Hourly Air Quality data and then the image changes to show Sarah Lawson talking to the camera]
So what that means for the community is that they can see in a glance what the air quality is like outside their window at a given time and how it compares to the rest of Queensland
[Image changes to show Sarah Lawson working inside the Ambient Air Quality Station and then the image changes to show Sarah Lawson talking to the camera]
and I think this is a really important part of the project. It provides complete transparency to the community.
[Music plays and CSIRO and GISERA logos and text appears: Gas Industry Social & Environmental Research Alliance] [Sponsors logos and text appears: www.gisera.org.au ]
Assessing the air quality in the Surat Basin – GISERA video
CSIRO, through the Gas Industry Social and Environmental Research Alliance (GISERA) ,is leading a study which includes collection of air quality measurements through a network of five ambient air quality stations in the Chinchilla, Miles and Condamine region of Queensland.
The data collected is streamed live to the Queensland Department of Environment and Heritage Protection website .
CSIRO atmospheric researcher Sarah Lawson said live streaming the data showed transparency of the data collection process.
“The data is accessible to everyone which means local communities and the general public can stay informed about the air quality in the Western Downs region, how it compares to other parts of Queensland and how levels compare to the government’s air quality standards,” Ms Lawson said.
The Air Quality Monitoring team within the Department of Science, Information Technology and Innovation (DSITI) will be responsible for publishing the air quality monitoring data on the DEHP website.
Queensland Minister for Innovation, Science and the Digital Economy, Leeanne Enoch said this was a great example of scientific collaboration between CSIRO and Queensland Government.
“Hosting the live air quality data from coal seam gas regions to local community and people of Queensland is a great way to show transparency and build confidence in the research that is taking place,” Ms Enoch said.
An air quality model will also be used to explore the degree to which different emission sources in the Surat Basin contribute to the levels of air pollution.
The model includes a variety of natural and man-made emission sources including the CSG industry, power stations, mines, livestock production, motor vehicles, bushfires, and vegetation.
By running the model with different emission sources switched on and off, the degree of contribution from sources, including the CSG industry can be investigated.
The model will also provide an understanding of the distribution of pollutants over a much larger area than can be determined by fixed monitoring stations.
“Both the air quality data and modelling results can be used by government to inform policy and regulations around CSG development and by industry to focus on improving practices that reduce emissions of pollutants” Ms Lawson said.
You can read more about this project here.
Fact sheet
- Surat Basin regional air quality, Queensland (PDF, 357 KB)
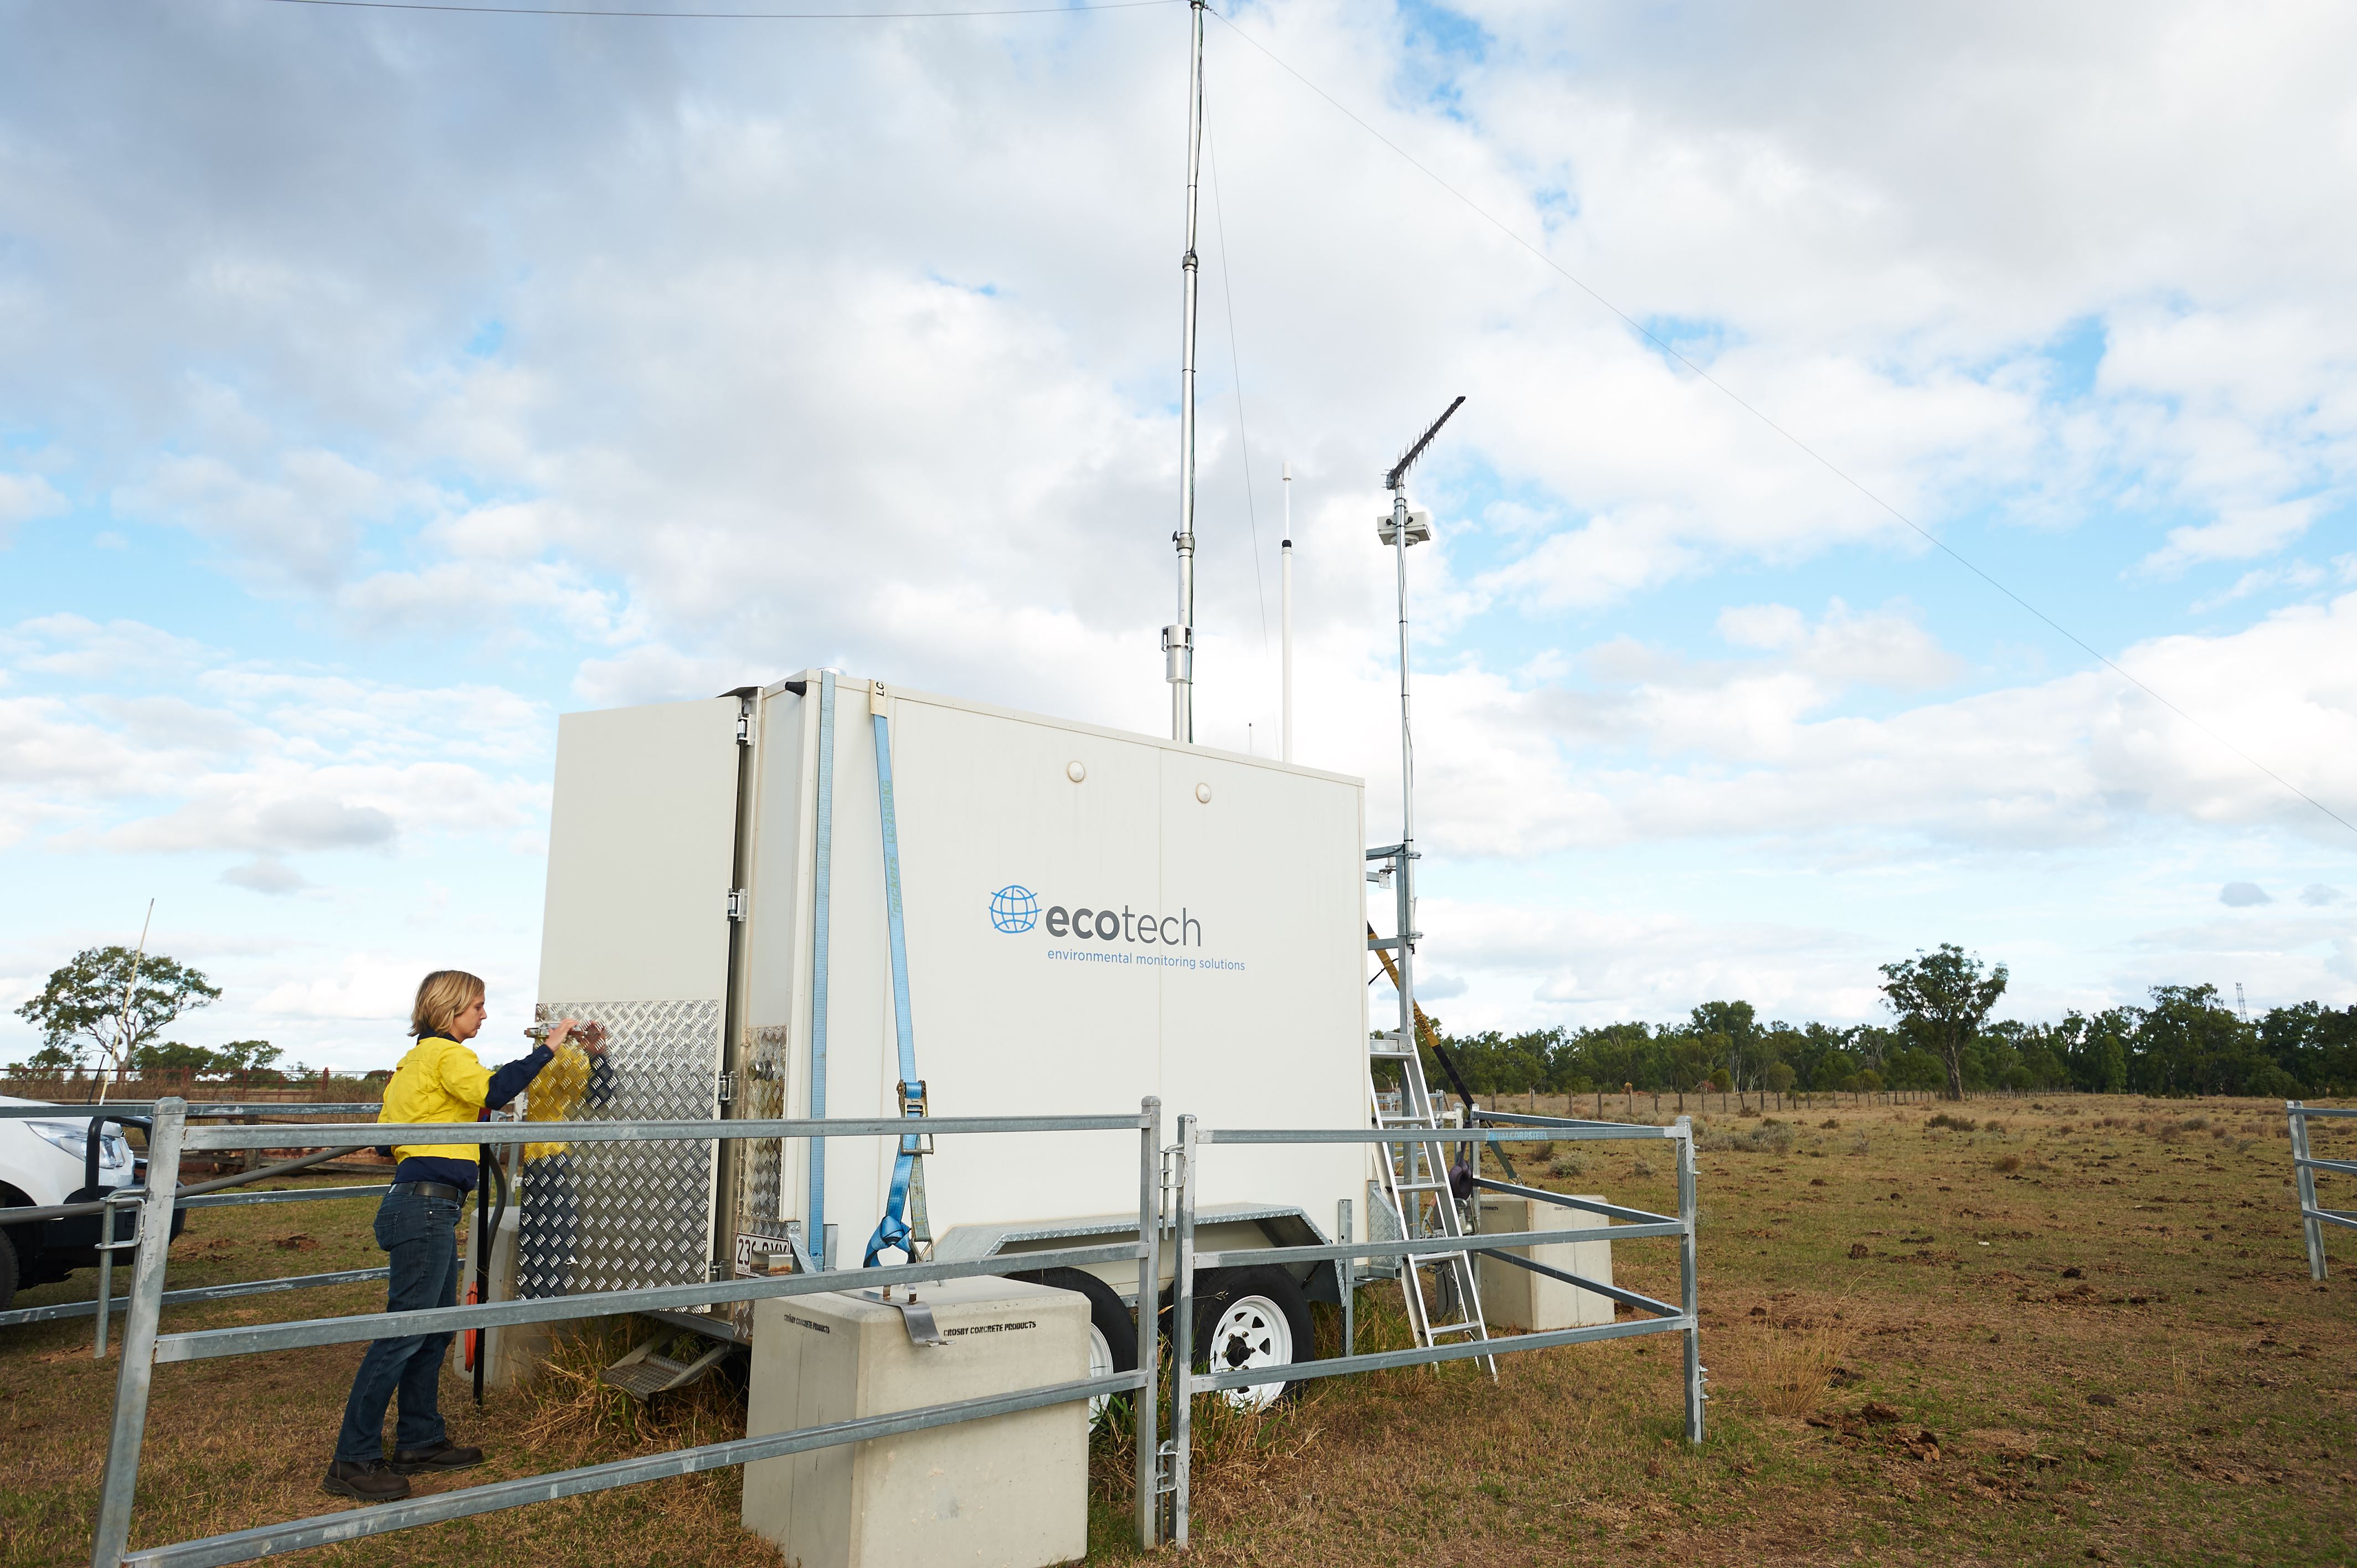
Air monitoring station